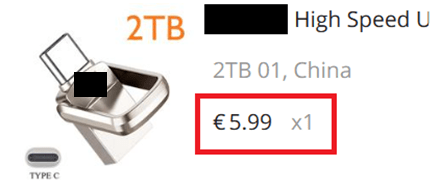
Out of the curiosity, I purchased a 2TB USB flash drive for an unbelievable price of 5.99 EUR. However, from the moment of purchase I couldn’t shake the suspicion that this deal was too good to be true. My aim upon receiving this flash-drive was to check if actual memory capacity was matching one that was advertised.
The advertisement boasted the flash drive as a product from a well-known Chinese brand, yet upon arrival, all traces of branding had mysteriously disappeared from the packaging leaving it grey and generic and I believe this serves as one of red flags.

In this post, I conducted a series of tests on this flash drive using various approaches. Two of the methods involved using software to write and verify data, while the third was a simpler approach, where I wrote larger video files to the flash drive and verified that the data remained intact.
!!! When doing these kinds of tests, please, make sure that you do not have any valuable data on the drive as these tests will destroy written data. Make sure flash-drive is empty or all data is safely backed up!!!
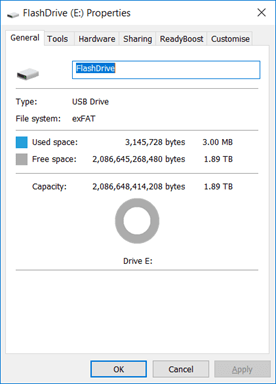
At the first glance we can see that the flash-drive has a memory capacity around 2 TB, this is because flash-drive is programmed to report this amount and it does not mean it is actually there. Let’s test it!
1st method
For this test I was using “Flash Drive/Card Tester” application visible in screens below and to be honest this was very time-consuming although the most precise one as it is going through every memory block. Unfortunately, that did not finish properly as the computer running the test halted after 360 hours of running, because of some pc error.
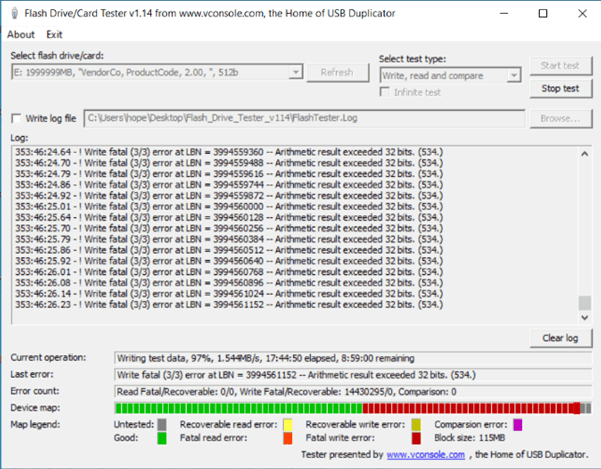
Initially writing speed was around 19MB/s then after 50% of memory checked it started to go down until by 90% it was only 1.5 MB/s, basically test was in crawling speed most probably because of writing errors it started to get after test went over 50% capacity.
Test using this method took a considerable amount of time and still by the end has failed although it looks like half of the memory capacity is green, still the actual numbers would have been much lower as it was unable to perform verification of written data.
2nd Method
This application was more efficient as it is partially checking the amount available by writing a smaller chunks of data and verifying it afterwards. With a previous method, application first tries to write data to all available capacity and then it is verifying data by reading it back and comparing.

This proved to be much quicker method compared to the first one I have tried as whole test just took less than 1 minute and deduced that only 16GB of 2TB is usable, rest is probably corrupted.
3rd method
This method is not using any software, you will need a couple of larger video files, or you can make several copies of the same video. We are writing those to the drive and checking right after if any of the files started to experience problems.


I managed to write about 16 GB of data until started to get reading errors for the newly added files which matches numbers I got with the 2nd test method.
Conclusions
This flash drive shouldn’t be used to back up some important data as it is a very high risk that this information will get lost, and I can imagine feeling when one is backing up all family videos in this device and later discovering that all is gone. This can happen because you are not getting errors when writing to flash-drive and exceeding 16 GB mark, but later you discover problems when the files are being read.
Be careful and do not trust scams like which are promising much memory for a very low price. Consider the risk and keep your valuable data backed up as even good equipment is prone to failing.
Hope this was interesting and useful for you, have a great day!
Sources
Info on fake Flash drives – 007 – All about ‘fake’ SD Flash cards/drives – RMPrepUSB